Detection of unusual travel patterns to prevent user account compromise
Client: Castle Intelligence, Inc.
Castle is a Y Combinator startup (YC W16) that provides automated detection of compromised user accounts and account hijack attempts for online businesses. Castle’s software records user interactions on their clients’ websites such as timestamps, user IP addresses, the details of the device used by the user, and the action performed on the website. Additional information can be obtained from the IP address such as the user’s approximate location and internet service provider. Castle analyzes this data in real time to identify malicious behavior by unauthorized users. If an action is determined to be suspicious, a request for secondary verification is sent to the owner of the user account—something you may have experienced when making a large credit card purchase when traveling in a new location.
The project
My consulting project is to develop an improved model for Castle to determine if a user action in a new location is legitimate. Two performance metrics are especially important to quantify an improvement in the model:
-
True positive rate (recall): what fraction of compromised accounts / fraud attempts does the model identify?
-
False positive rate: what fraction of legitimate users receive requests for additional authentication due to the algorithm incorrectly flagging their activity as suspicious?
From a business perspective, it is advantageous to maximize recall while minimizing the false positive rate. The higher the recall, the more effective the model is at identifying true malicious user actions performed by bad actors. Maximizing recall must be balanced against the need to minimize the false positive rate. If the model wrongly identifies an action by a valid user as suspicious, that user will have to manually confirm their legitimacy. In small doses, this is a tolerable requirement for most users—it can even provide some comfort that their account is protected—but it can become onerous if the false positive rate is too high. (The recall and false positive rate will be discussed quantitatively later in this post.)
My slides outlining the project are available here.
Data and approach
Castle provided one month of user data from one of their clients for this project. There are 2 million user events in the dataset and 200,000 users, so on average each user has ~10 events per month. In addition to the user action data, Castle provided a list of known compromised accounts. The incidence of account compromise is rare; only 0.2% of users reported that their account was compromised in the one month long interval.
Due to the imbalanced dataset and the large variation in the potential signature of compromised account, I used an unsupervised approach to detect these malicious events. This involved training a model on all of the data and using the resulting model to classify a certain fraction of outlying events as anomalous. These detected anomalous user events are interpreted to be potentially compromised accounts and require additional user identity verification. Using this type of anomaly detection to detect fraudulent account activity involves two major assumptions:
-
Since the unsupervised model is trained on all of the data, the fraction of events that are actually associated with compromised events is small.
-
The user event behavior of compromised accounts is different from the behavior of a legitimate user in a statistically significant way.
Data visualization
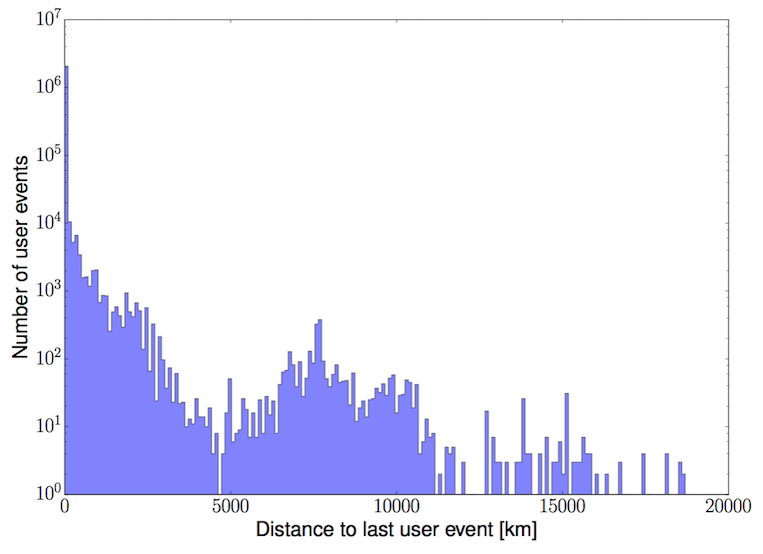
The figure below shows the distance between the user’s location for subsequent actions on the client’s website. There are several conclusions we can draw from this plot. First, almost all user actions (~99%) are performed at the same location as the previous action as indicated by the bin at 0 km. The second observation is that there is some structure to the distribution of non-zero distances between subsequent events. The counts between 0-5000 km are due to travel between two locations within the same continent. The counts between 5000-12000 km are primarily due to travel between two adjacent continents. The counts representing distances of >12000 km are due to subsequent logins on two different continents separated by an ocean.
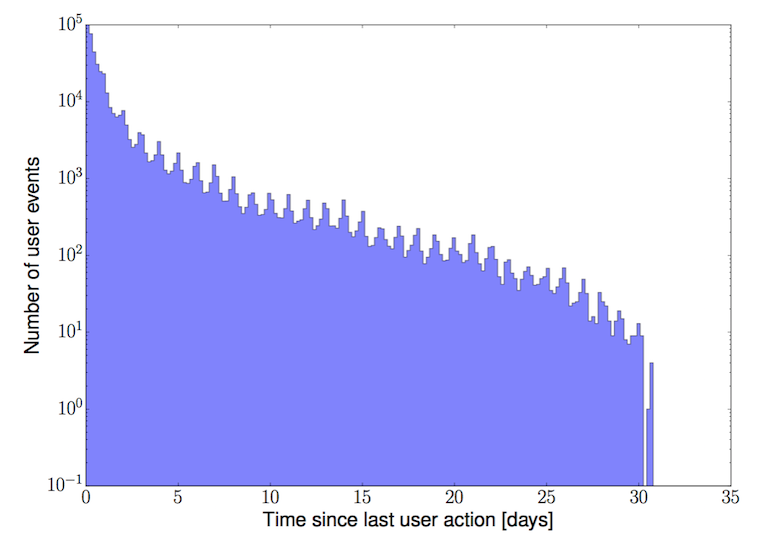
The time between subsequent user events can also provide information on their legitimacy. The figure below shows the time (in days) between subsequent events for each user for the month of data used for my analysis. The sharp increase in the number of user events with a time since the last event of 0-2 days indicates that most users are near-daily users of the client company’s website. A user action originating from an account that has been idle for several weeks is less common and thus more suspicious. There are ~30 periodic oscillations in the histogram that correspond to the change in user activity due to the day/night cycle. As one would expect, users are more likely to be online during the day.
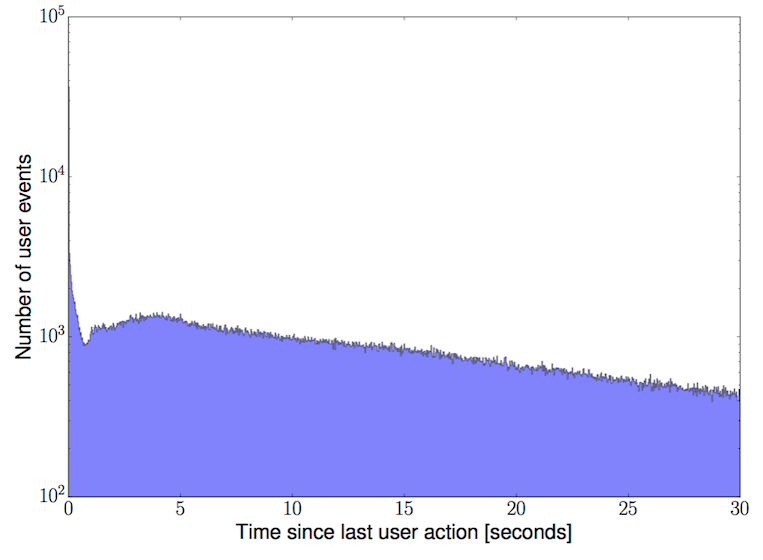
The figure below shows the same quantity, the time between subsequent events for each user, on a much shorter timescale. I’ve zoomed in to show the distribution between 0-30 seconds. The spike in the data on the far left side of the plot is due to events with a time separation of <1 second. These events are likely due to automated (non-human) actions and should be considered more suspicious. One way to include this information in the final model is to fit and subtract the automated user actions (events between 0-1 seconds) before using this feature as described in the “Detecting outliers” section later in this post.
Feature engineering
The key to developing an unsupervised anomaly detection system that performs well is engineering features that capture separation between normal user behavior and the behavior of potentially compromised accounts. The features used in my model can be categorized into two general classes.
The first class of features is used to quantify how unusual a particular user event is given the typical behavior of a client company’s user population. For example, if the user base of a particular client is localized to North America, then user events that originate from outside North America should naturally be considered more suspicious in the model. Features to quantify the likelihood of actions from a particular country or city are also included in the model. Furthermore, I quantify and incorporate the suspiciousness of the internet service provider from which the particular user action originates.
A second class of features is used to quantify how unusual each user action is given that particular user’s previous behavior. These values are used to incorporate information such as: if the user is logging in from a new city, country, or continent; if the user is logging in from a new device; the geographic distance between the current action and the previous action; the elapsed time between the current action and the previous action; and other similar per-user features.
Detecting outliers
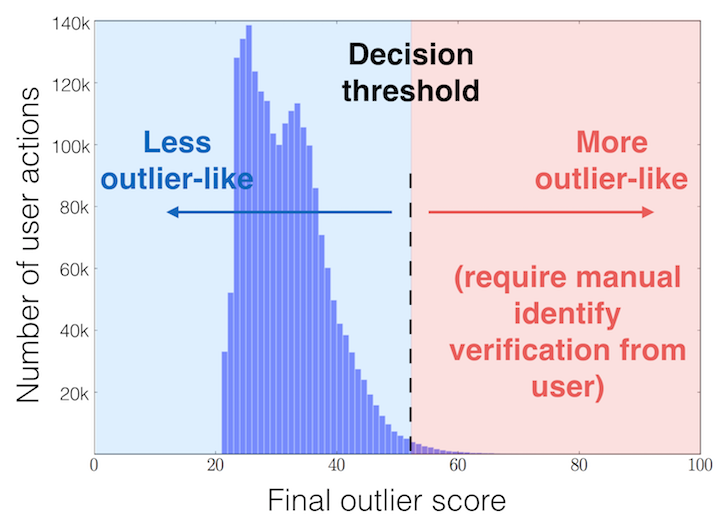
I developed a model for Castle in a Jupyter notebook that generates a probability density function (PDF) for each feature based upon the client’s data recorded to date. For each event, the likelihood of each feature taking a particular value is calculated, and these likelihood values are combined into a single figure-of-merit (the combined negative log-likelihood). The features are treated independently—similar to the feature-independence assumed in a Naive Bayes model. The final figure-of-merit is a single number that quantifies how “outlier-like” a particular event is in the dataset. A threshold is applied to the figure-of-merit to classify a small fraction of the data as outliers (and potential malicious behavior) that is worthy of further scrutiny. The figure below shows the distribution of this figure-of-merit for all events; less “outlier-like” events are on the left side of the distribution, while more “outlier-like” events are on the right side of the distribution.
This model has a number of advantages. The model exploits the information provided by both continuous and categorical features, and it is very simple to extend the model to include new features. The computational resources required for the initial PDF generation is very modest, and subsequent classification of incoming events can be done in real time. The relative importance of each feature can be inferred from the variance of its contribution to the final figure-of-merit score.
Performance of delivered product
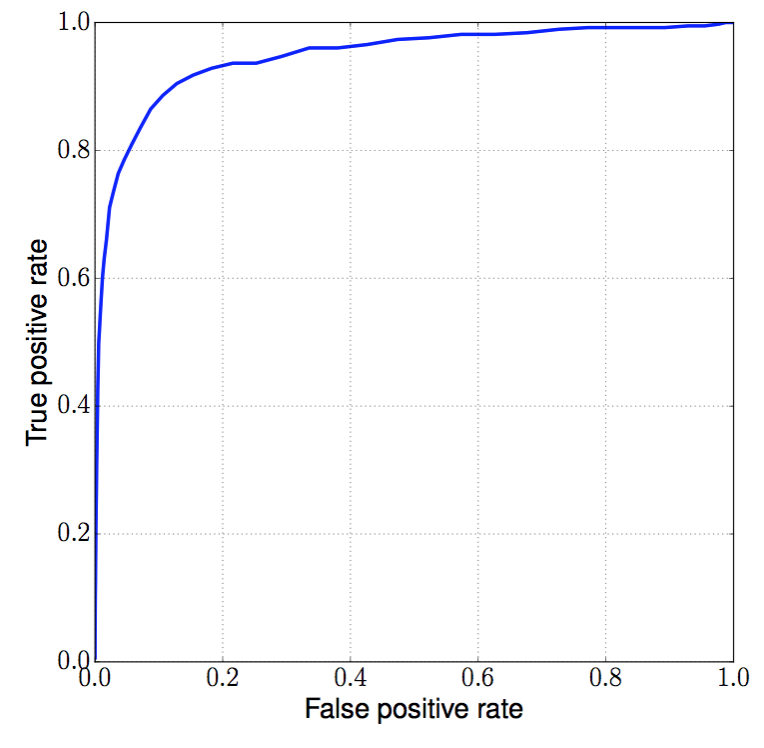
The receiver operating characteristic (ROC) for my anomaly detection model is shown in the figure below. The recall is plotted vs. the false positive rate for a variety of thresholds applied to the figure-of-merit. This curve describes the performance of the model in terms of the metrics of interest as a function of the tunable threshold parameter. The area under the curve (AUC) is often used to quantify a classifier’s overall performance; in this case, the AUC is 0.95, very good for an unsupervised fraud detection model! Castle’s current target is a false positive rate of 5%. My model has a recall of 79% with a false positive rate of 5%, which represents an improvement in recall of 2x over the baseline model with the same false positive rate. Given this significant improvement in performance, I’m working with Castle convert my model into an implementation that can be tested on live production data.
Future work
Generalization of the model to data from other clients
My model was trained and validated using the data from one of Castle’s clients. Castle’s broader client base includes a diverse set of companies with different business models, geographic locations, user behavior, and more. It is possible that the features that yield most of the discriminative power for this client company’s user base are not as useful for another client company’s data. If this is the case, new features tailored to that particular dataset can be engineered and incorporated into the model. I’m currently working with Castle to test the generalization of this model to datasets from other client companies.
Other improvements
Some next steps to enhance my current model include the following:
- It would be interesting to see if creating a multidimensional joint PDF of the feature space can improve the performance of the model.
- Develop more sophisticated engineered features that could be incorporated into the model to target specific types of fraudulent user behavior.
- It would be fun to try out alternative outlier detection algorithms such as k-NN, clustering, and one-class SVM.
Overall, the significantly improved performance over baseline, simple implementation, and real-time operation of my current model provides a high ROI.